Data Exploration
Explore data with statistical summaries and visualizations: univariate and bivariate analysis, frequency tables, histograms, and box plots explained.
3 min read · Updated August 8, 2026
Data exploration is about describing a dataset by means of statistical and visualization techniques. You explore data in order to bring its important aspects into focus for further analysis — before you fit any model, you want to know what each variable looks like, how variables relate to one another, and where the surprises hide.
Exploration answers questions like: What values does each attribute take, and how often? Where is the data concentrated, and how spread out is it? Which pairs of variables move together? Skipping this step is the most common cause of wasted modeling effort: the patterns you fail to see in exploration come back later as broken assumptions, leaky features, or models that learn the wrong thing.
Two Modes of Exploration
There are two fundamental modes, distinguished by how many variables you examine at once.
Univariate Analysis
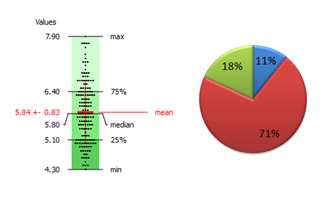
Univariate analysis explores variables one by one. The techniques differ by variable type: categorical variables are summarized with frequency tables and bar charts, while numerical variables call for measures of central tendency (mean, median, mode), measures of dispersion (variance, standard deviation, interquartile range), histograms, and box plots.
Bivariate Analysis
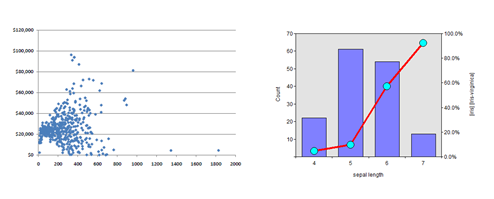
Bivariate analysis examines two variables simultaneously to uncover associations and differences. The right technique depends on the combination of types: contingency tables and chi-square tests for categorical vs. categorical, scatter plots and correlation for numerical vs. numerical, and error-bar charts, t-tests, and ANOVA for categorical vs. numerical.
In Practice
Modern exploration starts with pandas: df.describe(), df.value_counts(), and df.corr() reproduce nearly every statistic on these pages in one call, and libraries like Seaborn (sns.histplot, sns.boxplot, sns.scatterplot) render the same charts. Profiling tools such as ydata-profiling automate a full univariate plus bivariate report per dataset. The concepts here are exactly what those tools compute — the only thing that has changed since these tutorials were first written is the speed.
Common Pitfalls
- Modeling before looking. Fit nothing until you have seen every variable’s distribution and the key pairwise relationships.
- Trusting aggregates alone. Summary statistics can hide structure — always pair them with a plot.
- Ignoring data quality. Missing values, impossible values, and duplicates are exploration findings too; log them before you clean.
- Exploring the target leakage way. Be careful exploring features against the target on data you will later validate on — keep a held-out split pristine.
- Treating exploration as one-time. Re-explore whenever data is refreshed; distributions drift.
Summary
Data exploration describes a dataset with statistics and visualization before any modeling. Univariate analysis profiles one variable at a time; bivariate analysis examines pairs for association. The techniques in this section — frequency tables, histograms, box plots, scatter plots — are the vocabulary every later page in this library builds on.